

NVDA Stock Analysis 2024: Insights, Valuation, and Outlook
NVDA, or NVIDIA Corporation, has seen a remarkable rise in 2024, becoming a dominant player in the technology sector. Despite its rapid growth, some investors are questioning if NVDA has reached its peak. To answer this, let's delve into the company's performance, valuation, and future prospects.
This article is our personal opinion and is for educational purposes only. This is not a recommendation to buy or sell any securities. Always conduct your own research and consult with a financial advisor before making any investment decisions.
Summary of Key Points
NVDA has experienced significant growth in 2024, making it one of the largest companies by market cap.
Currently valued at $3.108 trillion, NVDA is the third-largest company behind MSFT and AAPL.
NVDA's business fundamentals are strong, with a valuation of $125 per share and top rankings in key financial metrics.
NVDA is a major holding in the S&P500, reflecting the confidence of fund managers in the company's future prospects.
The stock is currently range-bound but has a history of breaking out to the upside.
This analysis is contingent on no significant changes NVDA’s business fundamentals.
Finding this useful? Learn more here.
NVDA's Business and Rapid Growth
NVIDIA Corporation, known for its advanced graphics processing units (GPUs) and AI technology, has experienced rapid growth due to the increasing demand for AI and high-performance computing. NVDA's innovative products have made it a leader in various industries, including gaming, data centers, and autonomous vehicles.
Here are some metrics:
NVDA revenue for the quarter ending April 30, 2024 was $26.044B, a 262.12% increase year-over-year (YoY)
NVDA operating income for the quarter ending April 30, 2024 was $16.909B, a 690.14% increase YoY
NVDA net profit margin as of April 30, 2024 is 53.4%
NVDA is up 156.60% YTD at the time of this article.
Is NVDA Overvalued?
According to our valuation database, NVDA's current valuation stands at $125 per share, reflecting its strong business fundamentals.
NVDA also ranks 3/3 in our business metrics, showcasing strong fundamentals. The three key metrics are:
Cash to Debt Ratio: 2.54
A Cash to Debt Ratio greater than one means that the company’s operating cash flow is the same or more than their total debt. This signifies strong financial performance.
Debt to EBITDA Ratio: 0.31
A Debt to EBITDA Ratio less than or equal to three means that the company is able to pay back its debt in three or less years if net debt and EBITDA are held constant. This signifies the company is not over-leveraged.
Interest Coverage Ratio: 132.6
An interest coverage ratio greater than or equal to three means that the company can pay its interest payment on its debt 3 or more times with its operating profit. This signifies the company is poised to pay its debt as it grows.
NVDA in the S&P500
NVDA's inclusion as the third top holding in the S&P500 reflects its integral role in the economy. Institutional investors and fund managers recognize NVDA's value, reflecting their confidence in the company's future prospects.
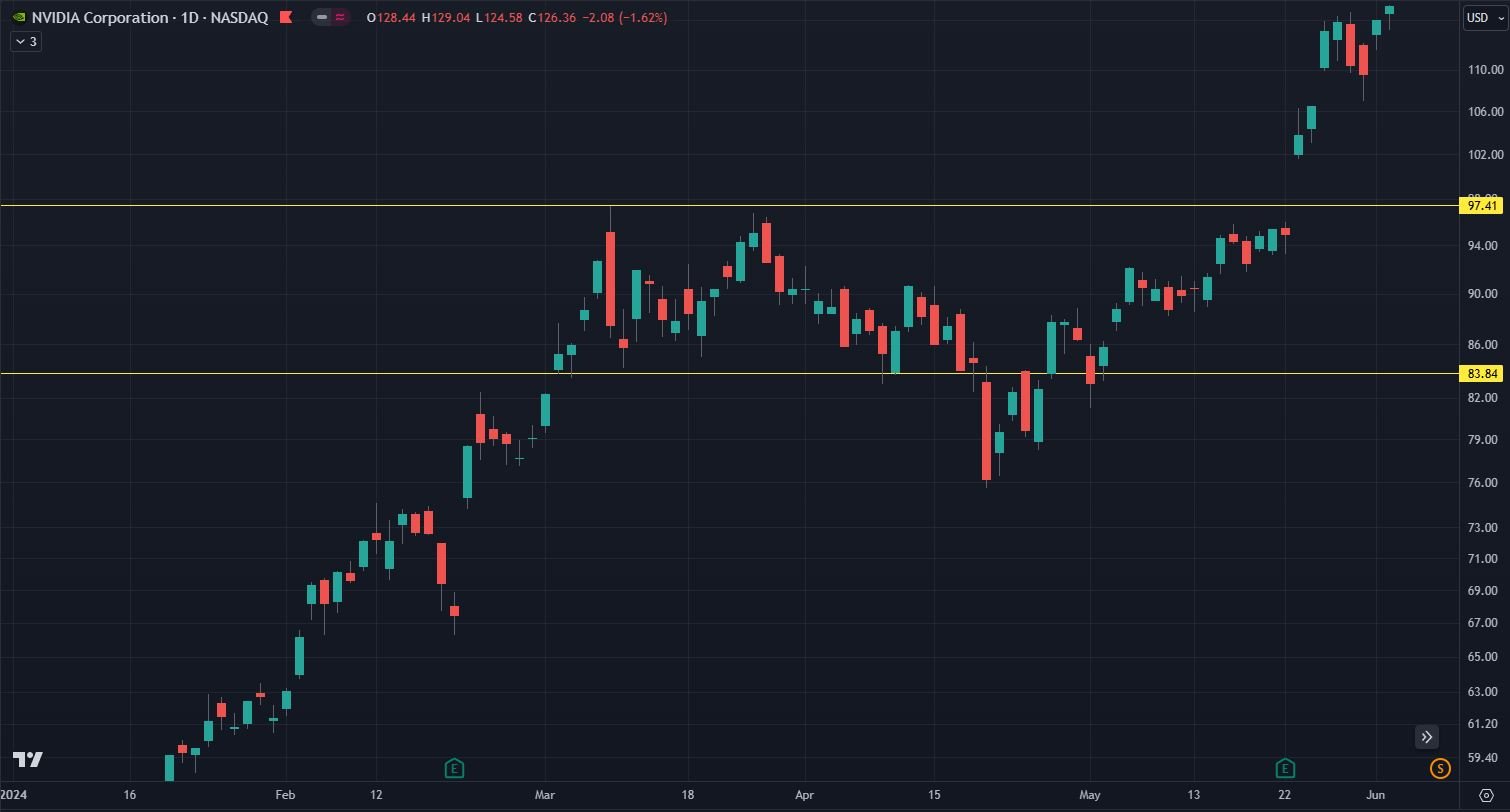
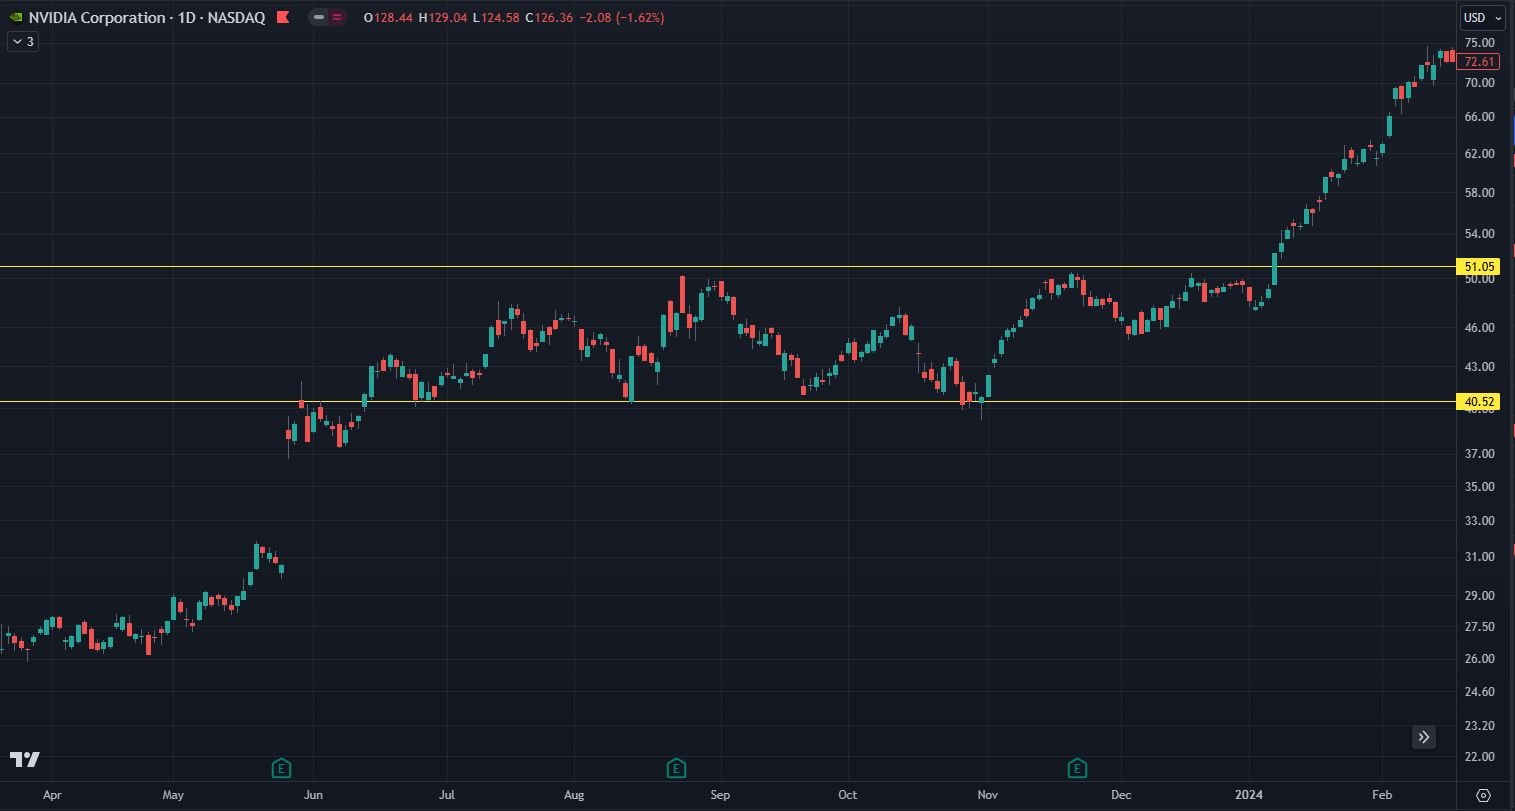
Technical Analysis
NVDA's historical pattern shows a tendency to move higher, followed by a period of sideways trading for at least a month before breaking out of the range and moving higher again. Typically, NVDA holds the lower end of the range, and if it does break below, it tends to recover within a few days. Since 2016, NVDA has only broken below its trading range during S&P 500 bear markets (2018, 2020, 2022).
NVDA's stock is currently range-bound, but its history suggests a higher likelihood of upward movement.

While past performance is not indicative of future results, NVDA's fair valuation, strong fundamentals, and significant weighting in the S&P500 all point towards a potential for continued growth.
As investors, it's essential to assess the probabilities of various scenarios rather than attempting to predict precise movements. Given NVDA's current position, the probability of breaking out to the upside seems higher, barring any significant changes in the business or market fundamentals.
Take the Next Step in Your Investing Journey – Join Us for Free!
Be a part of our growing community of investors and traders. Gain access to the following resources, all for free:
Valuation Database - monthly stock valuation estimates and analysis
Trading Strategies - generate consistent monthly income
Stock Alerts - be alerted on a compelling investment or trading opportunity
Market Analysis - weekly market analysis to ensure you’re always one step ahead
The Vault - your comprehensive resource for stock market articles
Disclaimer: The information provided in this article is for educational purposes only and should not be construed as financial advice. Always conduct your own research and consult with a professional financial advisor before making any investment decisions.