

Inverted Yield Curve: The Recession Predictor?
While it is true that an inverted yield curve, or an inverted interest rate curve, has predicted the past 7 recessions, it is important to understand how to interpret this data to avoid making impulsive decisions like selling all long-term holdings in anticipation of a recession or bear market. Using this knowledge can help develop an effective investing and trading plan that takes into account a yield curve inversion.
Key Points
The yield curve is a graph that plots interest rates of bonds with different maturities, typically showing long-term bonds having higher rates than short-term bonds.
An inversion occurs when short-term interest rates become higher than long-term rates, often seen as a predictor of economic recession.
An inverted yield curve suggests that investors expect slower economic growth or a downturn when the yield curve un-inverts back to normal after having been inverted.
The yield curve is currently still inverted, meaning that the market is expected to continue its bull market until the yield curves un-invert back to normal.
Finding this useful? Learn more here.
What is a Yield Curve and What Does It Show?
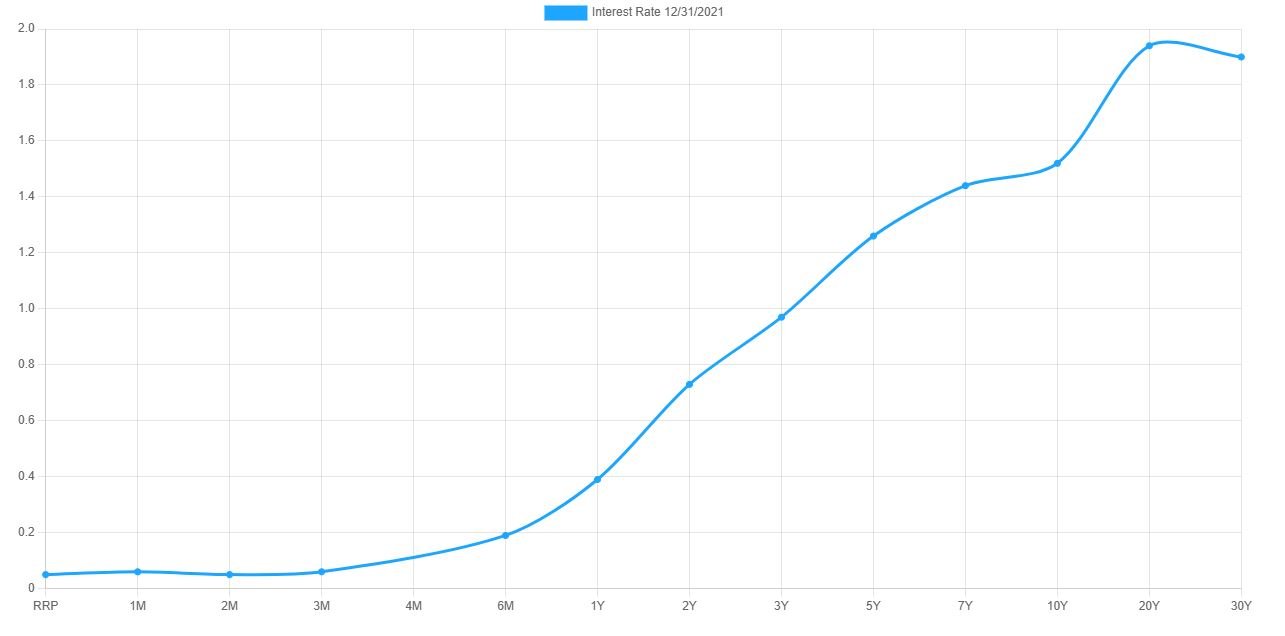
The yield curve is a graphical representation of the interest rates on debt for a range of maturities. Typically, it plots the yields (interest rates) of U.S. Treasury bonds from short-term (3 months) to long-term (30 years). Under normal circumstances, the yield curve slopes upward, indicating that longer-term bonds have higher yields compared to shorter-term ones. This upward slope reflects the risks and time preferences associated with holding longer-term securities.
What is a Yield Curve Inversion and Why Does It Happen?
A yield curve inversion occurs when short-term interest rates rise above long-term rates. This inversion can happen for several reasons:
Expectations of Economic Slowdown: Investors may expect slower economic growth or a recession, prompting them to seek the safety of long-term bonds, driving their yields down.
Central Bank Policies: Actions by the Federal Reserve, such as raising short-term interest rates to combat inflation, can also cause an inversion if long-term rates do not rise correspondingly.
Market Sentiment: A shift in investor sentiment towards risk aversion can lead to increased demand for long-term bonds, reducing their yields relative to short-term bonds.

What Does it Mean for the Economy and Stocks When the Yield Curve Inverts?
An inverted yield curve is often considered a leading indicator of economic recession. Here's why:
Recession Predictor: Historically, yield curve inversions have preceded many recessions. The inversion reflects investor pessimism about future economic growth, which can lead to reduced investment and spending.
Impact on Stocks: For the stock market, an inverted yield curve can signal caution. Investors may expect lower corporate profits and higher market volatility, leading to a potential sell-off in equities.
Credit Conditions: Inverted yield curves can tighten credit conditions as banks become less willing to lend, further slowing economic activity.
Yield curve inversions are commonly measured 3 ways:
10-Year Treasury / 3-Month Treasury Spread
10-Year Treasury / 1-Year Treasury Spread
10-Year / 2-Year Treasury Spread
Below is a graph that shows the 10-Y / 2-Y spread from 1986 to present day.

From the graph above, it can be noted that recessions tend to occur after yield curves invert AND un-invert again (as seen from the yield curve ratio line dropping below the 0 line and rising back above the 0 line before a recession is recorded).
Current Yield Curve Inversion Analysis
Currently, the yield curve is inverted. Below are the dates when the yield curve inverted for each of the 3 spreads:
10-Y / 3-M: October 2022
10-Y / 1-Y: July 2022
10-Y / 2-Y: July 2022
For simplicity, we’ll continue referencing the 10-Y / 2-Y spread for the remainder of this analysis.
The S&P500 has returned approximately 33% since the yield curve inverted in July 2022. Investors and traders who were uninformed about how to interpret yield curves may have missed out on this gain if they chose to sell their stocks in anticipation of a recession and significant drawdown. As noted above, the data shows that recessions tend to occur after the yield curve un-inverts back to normal after having been inverted. Until then, the market can be expected to continue its bull market.
The longest the yield curve stayed inverted was in 1969, staying inverted for 25 months before un-inverting back to normal. The current yield curve inversion has lasted 23 months so far, recently surpassing the yield curve inversion in 1973, which stayed inverted for 22 months before un-inverting.
Does this mean the yield curves will un-invert soon? Of course, nobody can say with certainty. But it doesn’t mean we can’t keep our eyes on the yield curve and prepare for a possible recession coming.
How to Prepare for a Possible Recession?
This does not mean that we will be getting a recession with 100% certainty. However, an investor should try to prepare themselves for any economic and market situation that may come.
Aim for consistent monthly savings within your current budget and lifestyle.
Ideally, you should have an emergency fund that covers six months of essential expenses, such as rent, food, and utlities.
Create and stick with a budget that helps grow your savings.
Recessions can provide opportunities for people to acquire investments for a lower price, so make sure there is enough savings to be able to take those opportunities.
Continue investing the stock market.
Although a recession might lead to a market downturn, continuing to invest in strong, resilient companies can position your portfolio for significant gains when the economy recovers, allowing you to benefit from acquiring valuable stocks at lower prices.
Take the Next Step in Your Investing Journey – Join Us for Free!
Be a part of our growing community of investors and traders. Gain access to the following resources, all for free:
Valuation Database - monthly stock valuation estimates and analysis
Trading Strategies - generate consistent monthly income
Stock Alerts - be alerted on a compelling investment or trading opportunity
Market Analysis - weekly market analysis to ensure you’re always one step ahead
The Vault - your comprehensive resource for stock market articles
Disclaimer: The information provided in this article is for educational purposes only and should not be construed as financial advice. Always conduct your own research and consult with a professional financial advisor before making any investment decisions.