

Assessing the Market Pullback: Are We Near the Bottom?
The market has recently experienced a pullback, leading many to speculate if we have reached the bottom. Seasoned investors and traders understand that it’s impossible to predict the bottom of a pullback. Instead, the focus should be on identifying signs that the current pullback might be nearing its end. This article aims to highlight these signs and provide a thoughtful analysis of the market's current state.
Key Points
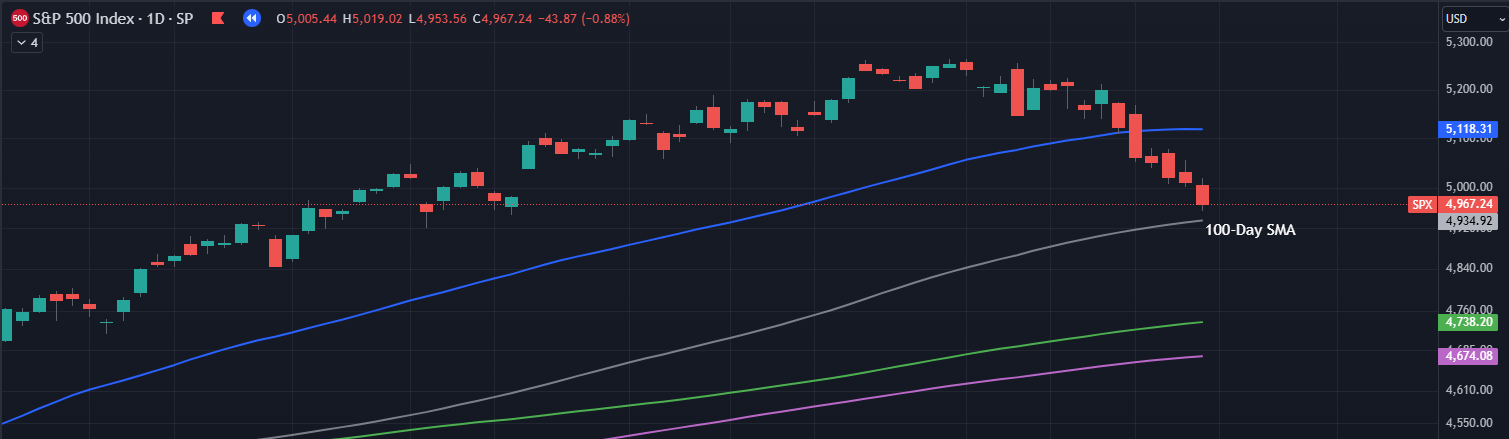
The confluence of the 61.8% Trend-Based Fibonacci retracement and the 100-Day SMA combined with Volume Price Analysis insights, suggest a possible end to the current pullback.
Investors interested in adding shares to their portfolio might consider using a portion of their cash reserves they want to use, such as 25%, at this level. This approach allows investors to potentially benefit from this pull-back while balancing the risk of entering too early or missing out.
Upcoming earnings reports from mega-cap stocks are highly anticipated and have the potential to influence market direction.
Finding this useful? Learn more here.
Technical Analysis
It’s important to note that in technical analysis, there is no “one indicator fits all” concept. Each of these indicators individually aren't enough to form a conclusion, but when used together, you can look for confluence or agreement between the indicators that can be a powerful market signal. Let’s see how this works below.


Fundamental Analysis
On the fundamental side, several market-moving events are on the horizon such as earnings reports from mega-cap stocks (GOOGL, AMZN, MSFT, etc.) which are highly anticipated. These earnings have the potential to influence market direction, depending on their performance in the previous quarter. Additionally, the Federal Open Market Committee (FOMC) interest rate decision on May 1, 2024, is another critical event that could sway market sentiment.
Given these upcoming events, some traders may look to reduce risk in their current trades. Averaging in at this level is one approach that could allow participation in market movements without the fear of missing out or entering too early, should the market continue to decline. After these events clarify market direction, another strategy might be to analyze the potential benefits of gradually increasing investment exposure based on additional confirmation signals.
What are the Confirmation Signals to Look For?
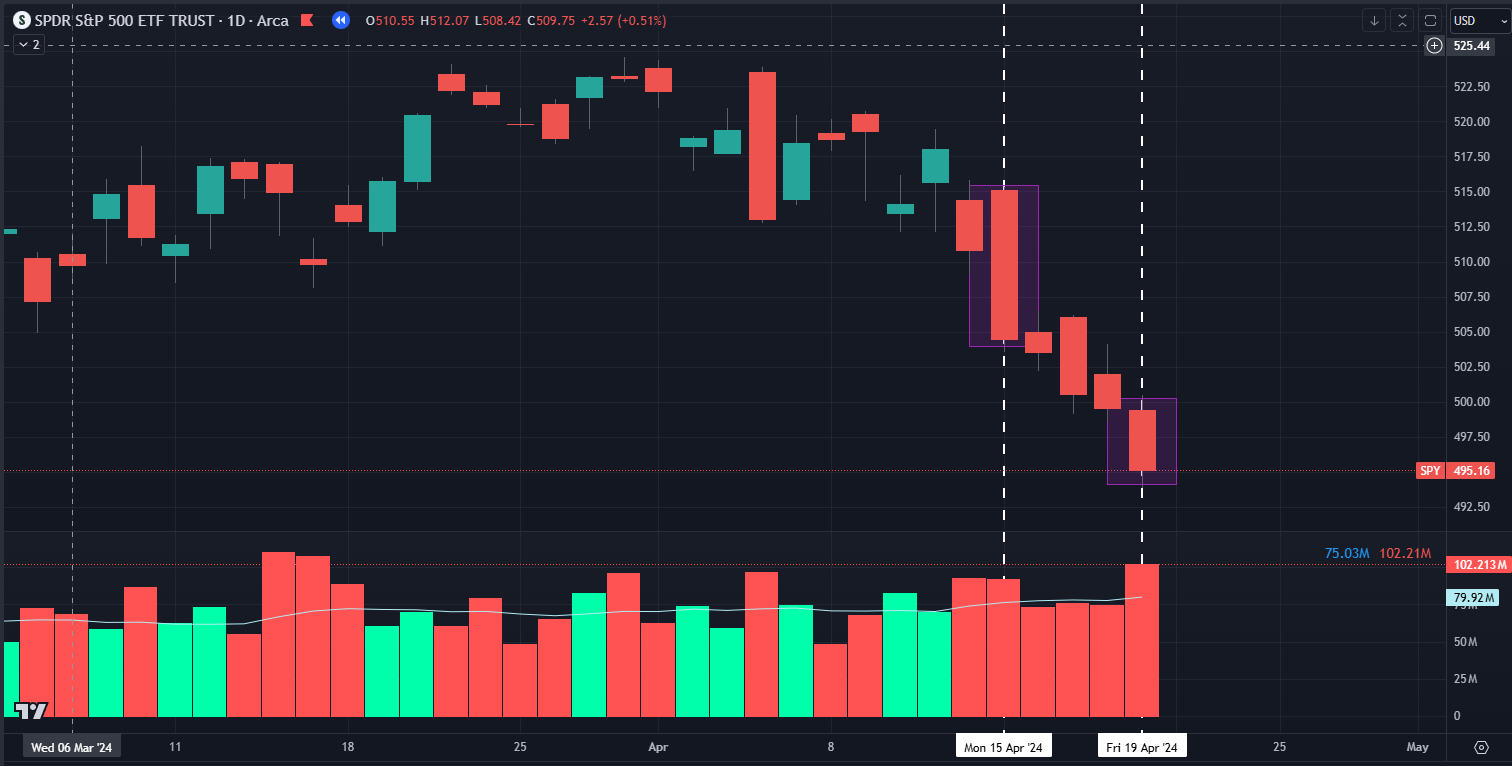
1. SPY price action “bouncing” off of this $495 support level and moving higher towards the 50-Day SMA.
2. SPY closing above the 50-Day SMA.
3. SPY closing above Anchored Volume Weighted Average Price - Quarterly (AVWAP-Q)
4. 20-Day EMA crossing above the 40-Day EMA.
Conclusion
While it's tempting to predict the bottom during market pullbacks, the wise approach is to observe key technical and fundamental signals that indicate a potential change of trend. The confluence of the 61.8% Trend-Based Fibonacci retracement and the 100-Day SMA combined with VPA insights, suggest a possible end to the current pullback. However, caution is warranted given the upcoming earnings reports and FOMC decision. By taking a measured approach and gradually adding to positions, investors and traders can navigate these uncertain times with greater confidence and reduced risk.
Take the Next Step in Your Investing Journey – Join Us for Free!
Be a part of our growing community of investors and traders. Gain access to the following resources, all for free:
Valuation Database - monthly stock valuation estimates and analysis
Trading Strategies - generate consistent monthly income
Stock Alerts - be alerted on a compelling investment or trading opportunity
Market Analysis - weekly market analysis to ensure you’re always one step ahead
The Vault - your comprehensive resource for stock market articles
Disclaimer: The information provided in this article is for educational purposes only and should not be construed as financial advice. Always conduct your own research and consult with a professional financial advisor before making any investment decisions.